

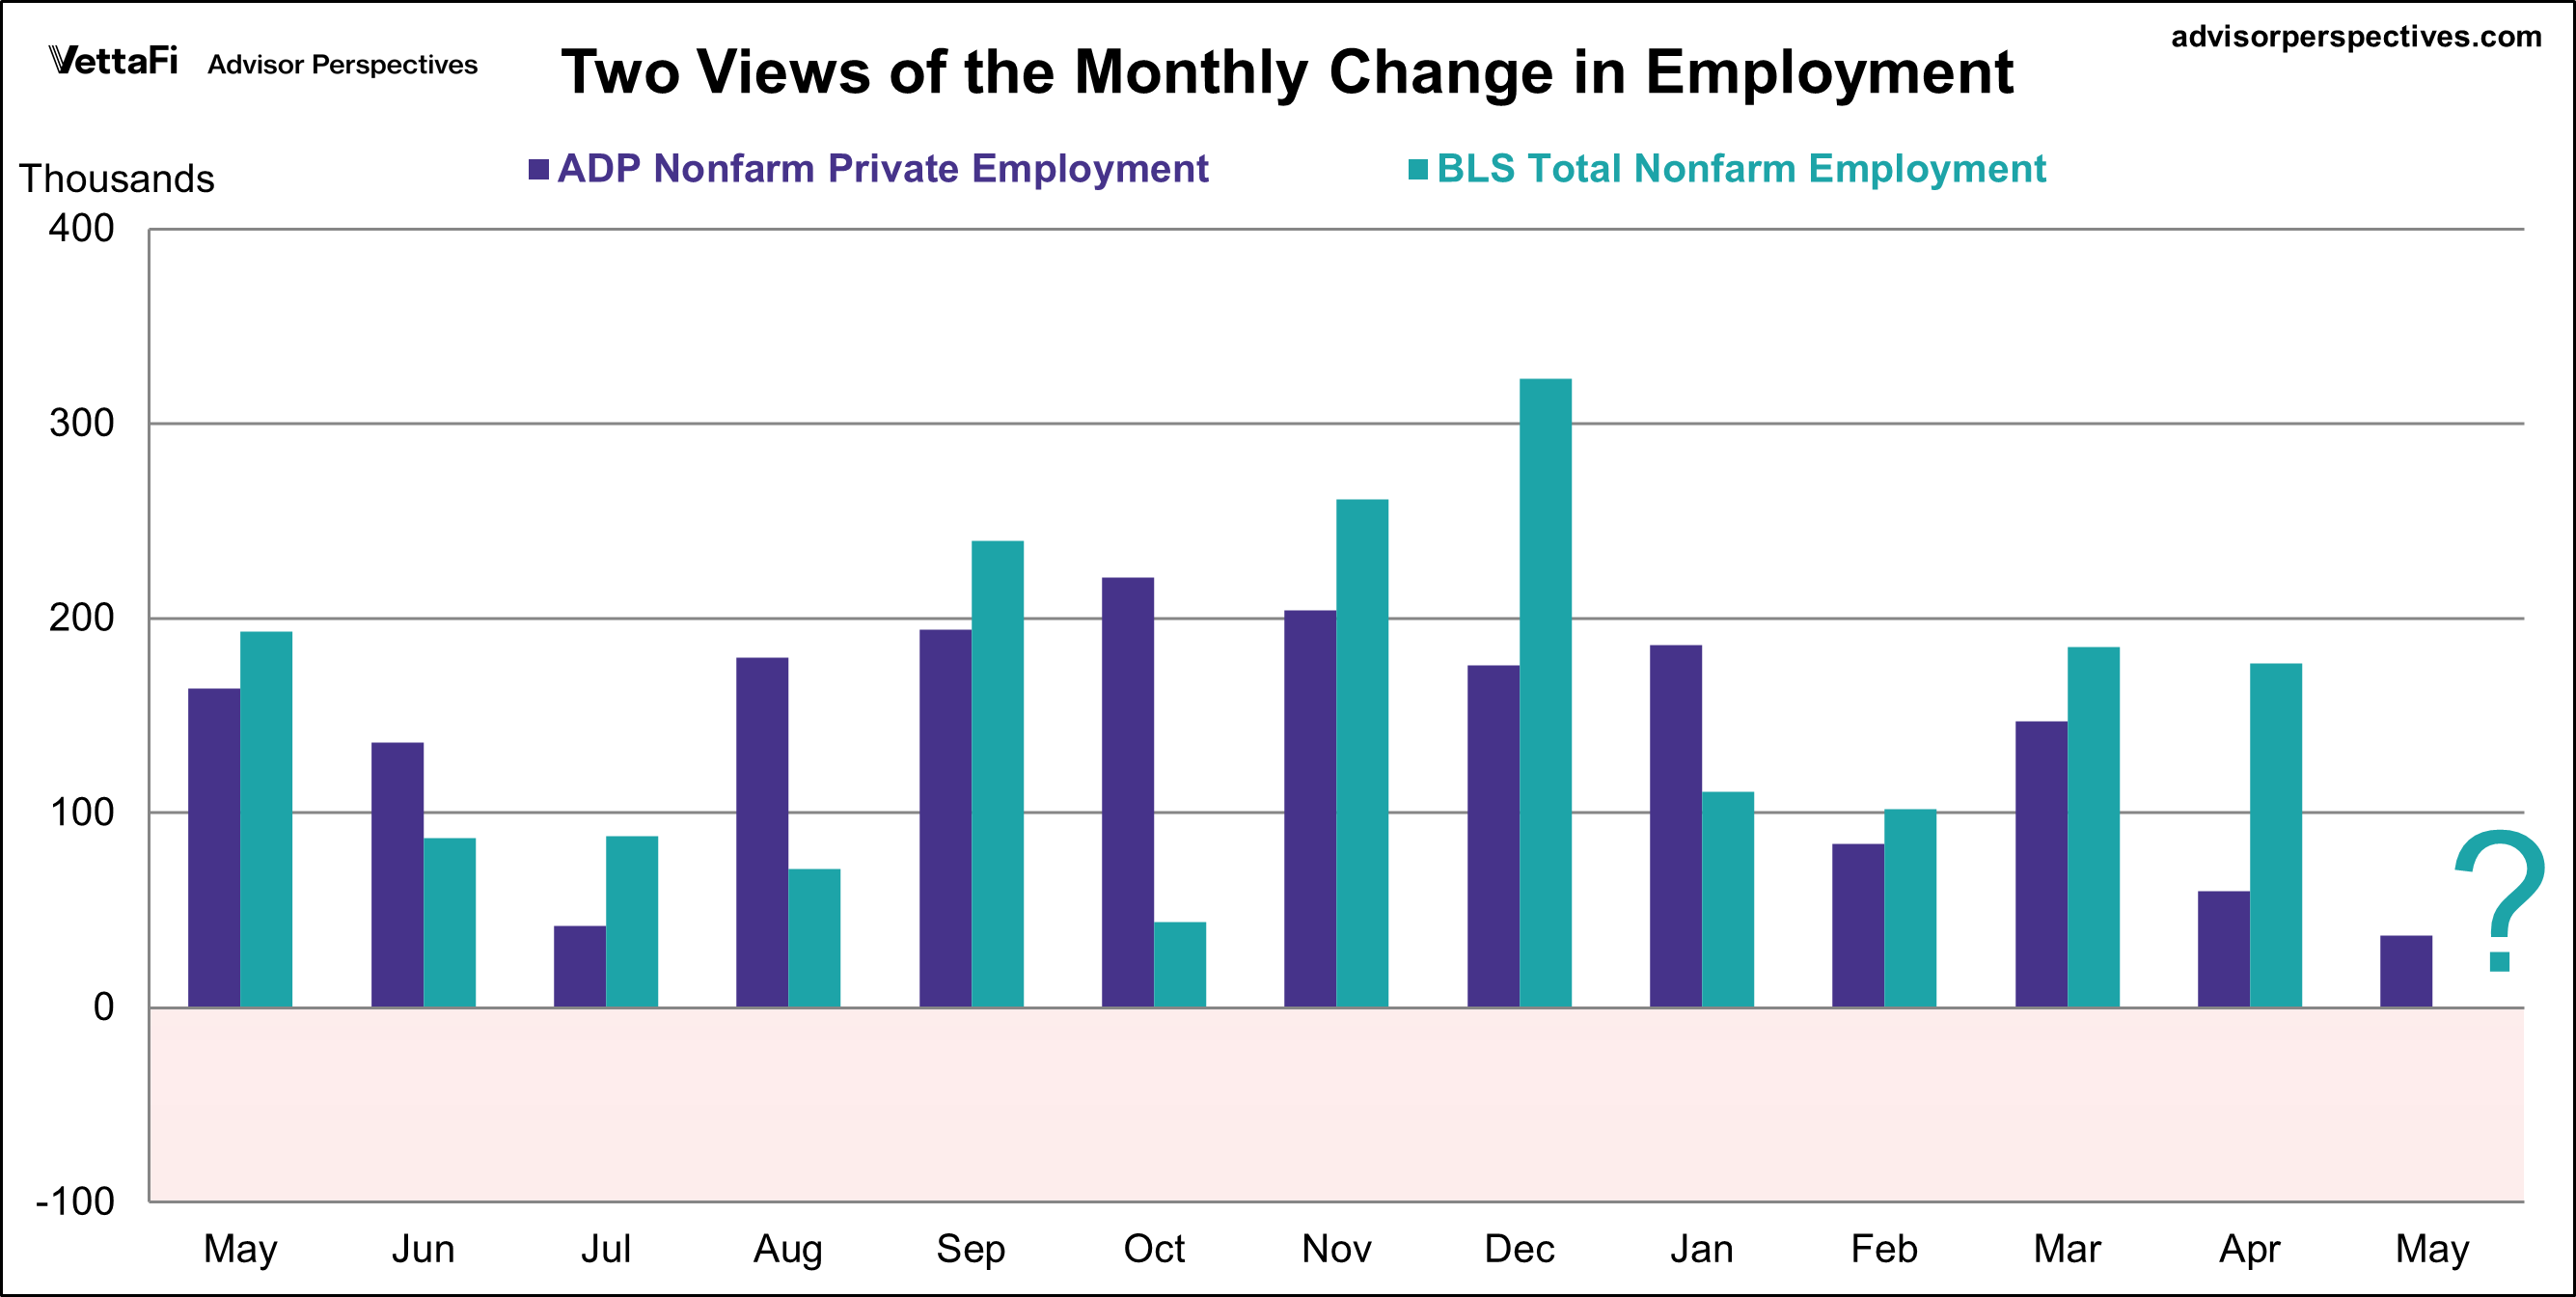
The economic mover and shaker this week is Friday’s employment report from the Bureau of Labor Statistics. This monthly report contains a wealth of data for economists, the most publicized being the month-over-month change in Total Nonfarm Employment. The forecast for the forthcoming BLS report is that 129,000 jobs were added in April. However, each month a few days before we receive the highly anticipated jobs report, ADP releases their data on new nonfarm private jobs. The ADP employment report revealed that 37,000 nonfarm private jobs were added in May, down from 60,000 in April. This is the lowest level since March 2023 when there was a reduction of 53,000 jobs. The latest reading was lower than the expected 111,000 addition.
Here is a visualization of the two series over the past twelve months. There is no correlation between the ADP and BLS employment report.

Here is an excerpt from today’s ADP report press release:
“After a strong start to the year, hiring is losing momentum. Pay growth, however, was little changed in May, holding at robust levels for both job-stayers and job-changers.
Here is a snapshot of the monthly change in the ADP headline number since the company’s earliest published data with the new methodology in 2010. This is quite a volatile series, so we’ve plotted the monthly data points as dots along with a six-month moving average, which gives us a clearer sense of the trend. The latest six-month moving average is 115,000, the lowest level in ten months.
 As we see in the chart above, the trend peaked in September 2015 and then went negative for the first time in late 2019, just before the NBER declared a recession start. The COVID-19 pandemic has brought employment numbers down to levels we have never seen this century. The trend reached a new high in 2021 at 875,000 and has recently dropped back to pre-pandemic levels.
ADP Employment: Industry
ADP also gives us a breakdown of Total Nonfarm Private Employment into two categories: Goods Producing and Service Providing. The US is predominantly a services economy, so it comes as no surprise that Services employment has shown stronger jobs growth. It makes sense that service-producing employment has plummeted during the pandemic for a couple of reasons – our economy is mostly supported by service-producing jobs, and during the pandemic, those same services were brought to a halt. In May, goods-producing jobs fell by 2,000 while service-providing jobs added 36,000.
The sector with the largest growth in April was Leisure & Hospitality with a gain of 38,000. The biggest loser last month was Professional & Business Services with a loss of 17,000 jobs.

The next chart is a linear representation of each industry’s contribution to overall employment from the start of the series.

ADP Employment: Region
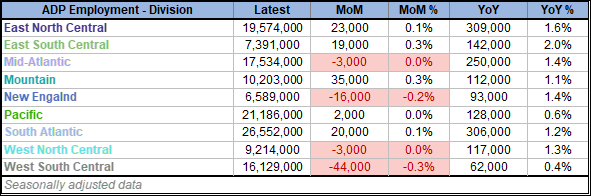
ADP also gives us a breakdown of Total Nonfarm Private Employment into nine regions (census divisions). The region with the largest growth in May was the Mountain region, with a gain of 35,000 private jobs. Meanwhile, the West South Central region experienced the largest loss at -44,000.
The next chart is a linear representation of each region’s contribution to overall employment from the start of the series.

ADP Employment: Establishment Size
ADP also gives us a breakdown of Total Nonfarm Private Employment into five sizes. Establishments with 50-249 employees was the only group that saw growth in May, gaining 51,000 jobs while those with 20-49 employees experienced the largest loss at -7,000.

The next chart is a linear representation of each establishment size’s contribution to overall employment from the start of the series.